Tuft & Needle was struggling to compete in the increasingly crowded mattress industry. Competitor copycats made differentiation incredibly hard while competitors’ shady marketing tactics drowned our message.
As copius research has shown, brand-building conversion rate optimization is largely influenced by usability. Thus, we chose to focus on this as the primary driver for this project. I pulled together a team of UX designers, user researchers, engineering managers, and project managers across three product teams to work on improvements spanning the site funnel.
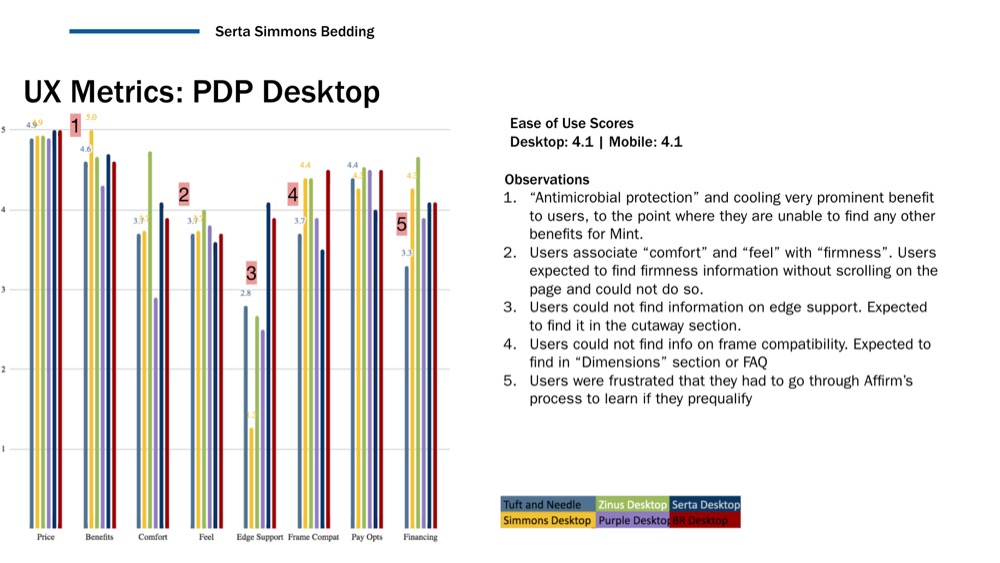
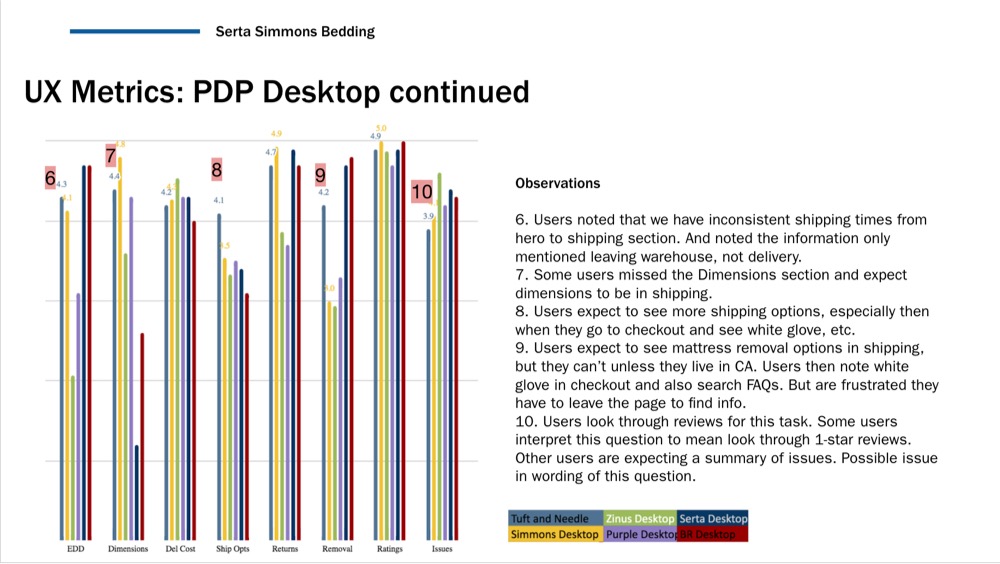
Identifying problem areas through a usability benchmarking study
To help identify problem areas (and serve as a means of measuring improvements), our user researcher conducted a usability benchmarking study across 15 metrics on nine major site pages. Meanwhile, I used Google Analytics to review page performance and identify the most significant areas of drop-off in our funnel.
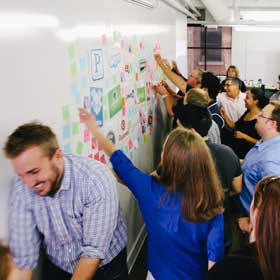
Following our initial research, I facilitated three ideation workshops, one each with the Customer Acquisition, Product Discovery, and Purchase Experience product teams. Using the benchmarking study as our guidepost, we ideated ways to improve usability and increase conversion.
An imperfect prioritization process
Due to limited team resources and excessive priorities, I worked with the teams to identify the ideas with the highest potential impact and lowest implementation effort. Admittedly, the decision process was mostly subjective, based largely on gut and past performance.
Guiding strategy and removing roadblocks
The teams then got to work implementing the ideas as A/B tests. I met with them each week to guide strategy, provide feedback on designs, interface with data science, troubleshoot implementation issues, and unblock resources. Each month, I presented our progress and findings to the executive leadership team and addressed any problems while getting more buy-in for the work.
$8 million in Q1, but wanting to do more
In Q1 of 2021, we launched 12 experiments. We had some successes and, of course, some failures. These led to $7.58M in incremental annualized revenue for the company. While I was happy with our momentum, I wanted to find a more scientific way to prioritize what the teams worked on. And so, I went to work creating an algorithm to predict potential revenue for each experiment idea.
A closer look at conversion rate optimization (CRO)
To get started, I put together a general list of all the ways we might improve conversion by helping our customers:
- Solving customers’ problems
- Showing clear differentiation between options and between competitors
- Simplifying options
- Showing the benefit to the customer, not just speaking to features
- Providing the right information at the right time
- Following typical ecommerce patterns that people are familiar with
- Decreasing clicks/steps to accomplish a goal
- Letting customers know about money and time savings
- Moving important information “above the fold” where the user is more likely to see it
- Improving affordance
- Being consistent with UI, writing, and flow
- Using straightforward, instructive copywriting
- Increasing accessibility
- Maximizing site speed
I realized that I was not a good enough data scientist — or one at all ;) — to predict the impact of each of these types of changes and that we might make several of these changes at once, further compounding the algorithm. And so I tried another way of thinking about this.
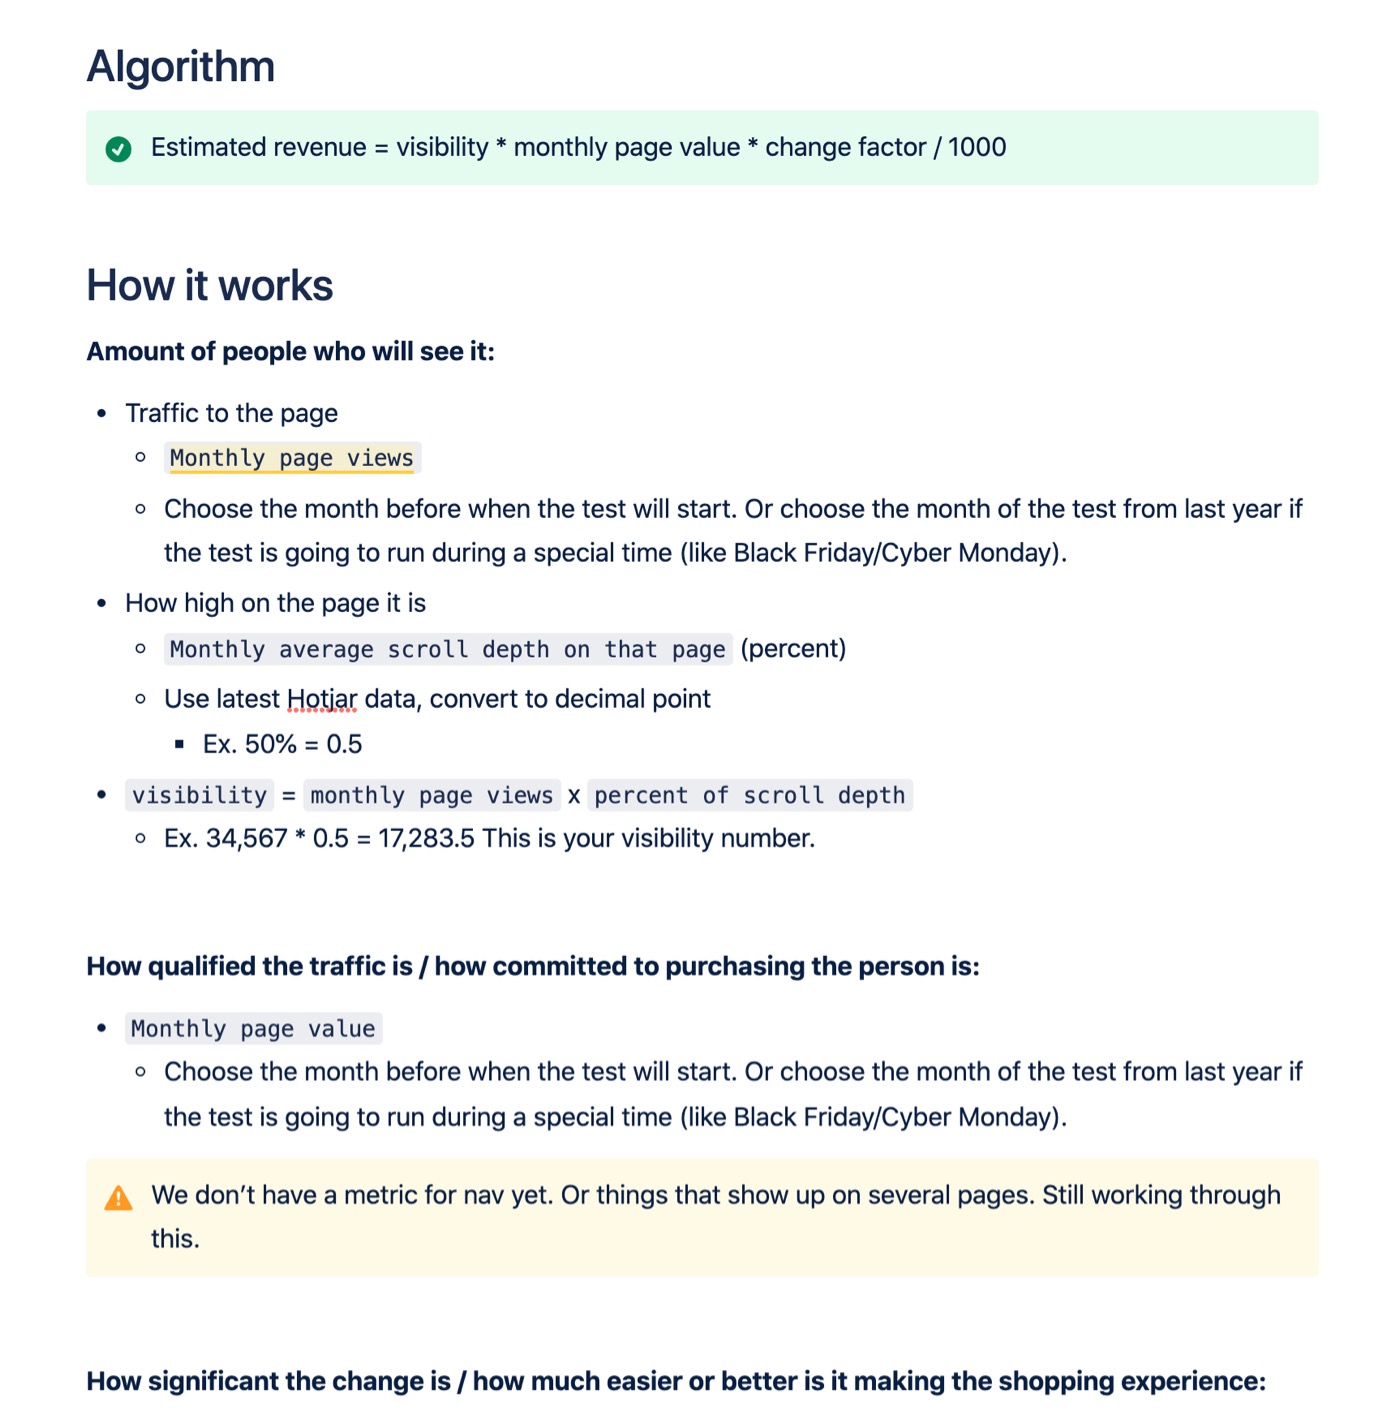
A revenue algorithm is born
Zooming out a bit, I realized that revenue made from an experiment would generally be influenced by:
- How many people see the experiment
- How qualified the traffic is, or in other words, how far down the purchase path the person is
- How significant the change is from the baseline
Using Google Analytics as the data source, I took a stab at creating an equation that matched the revenue data we were collecting and then calibrated it using additional past tests.
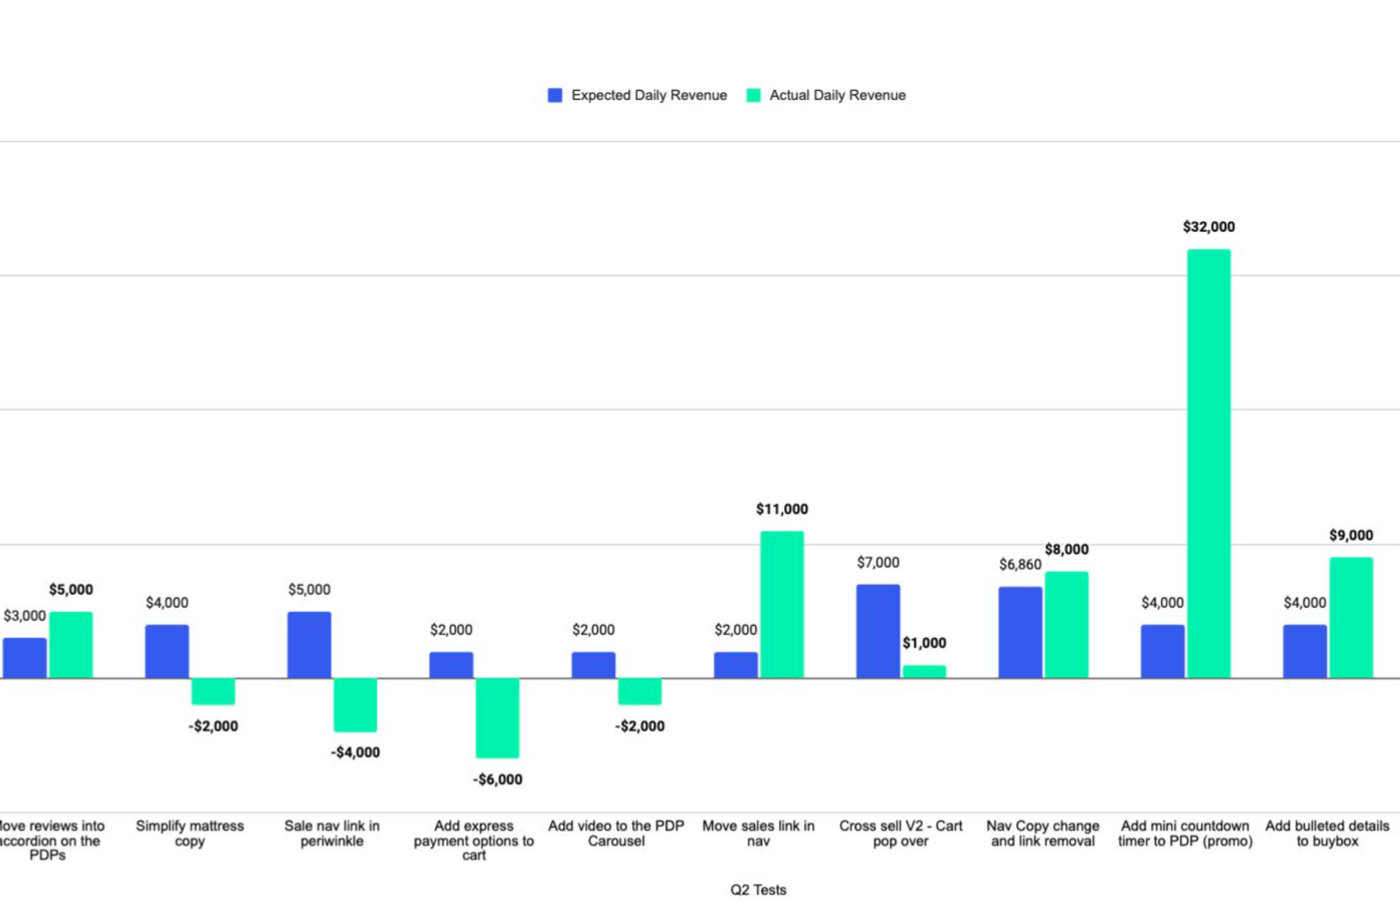
Algorithm success: 132% increase in Q2!
After vetting the algorithm with the data science team, I rolled it out to the CRO team to begin using for prioritization in Q2. I’m excited to report that we increased the annualized revenue by 132% that quarter by using this method!
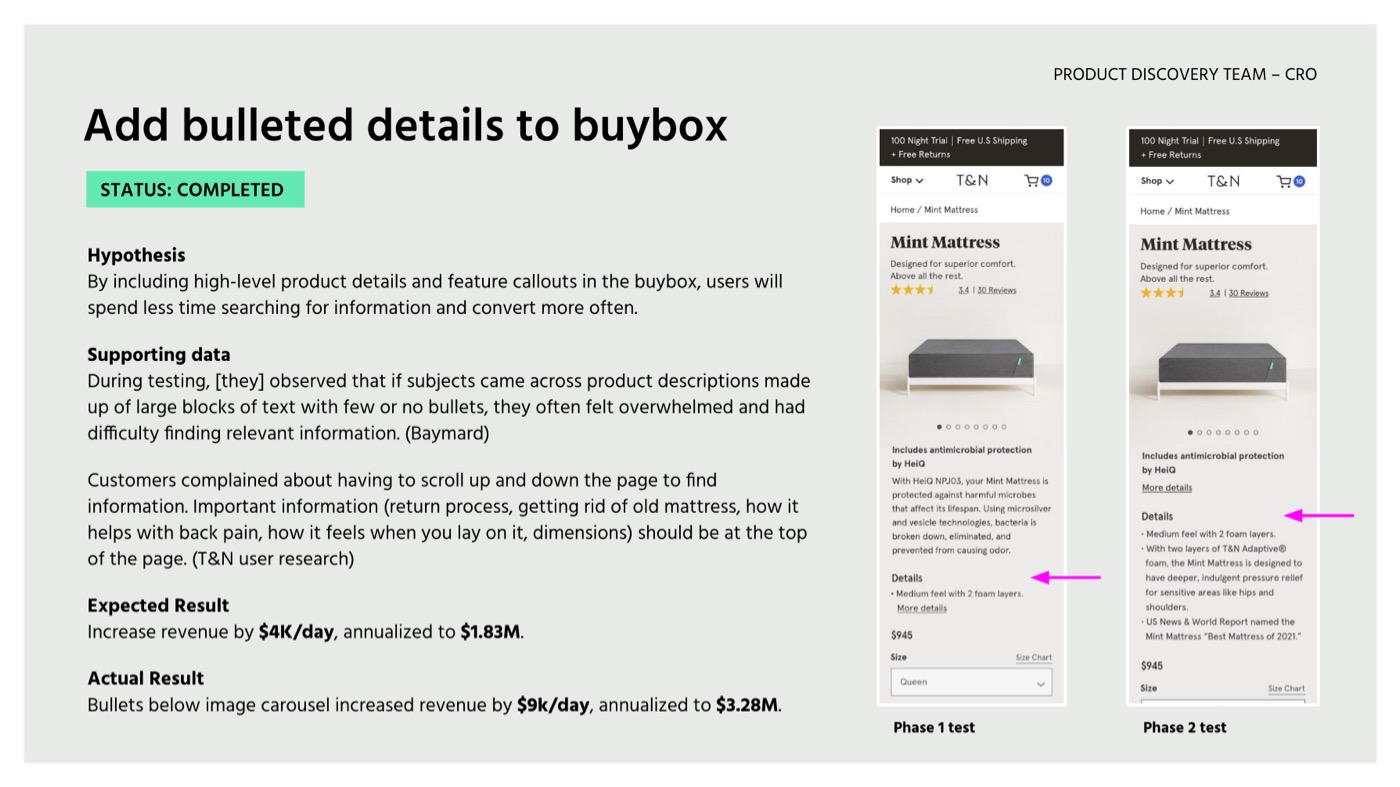
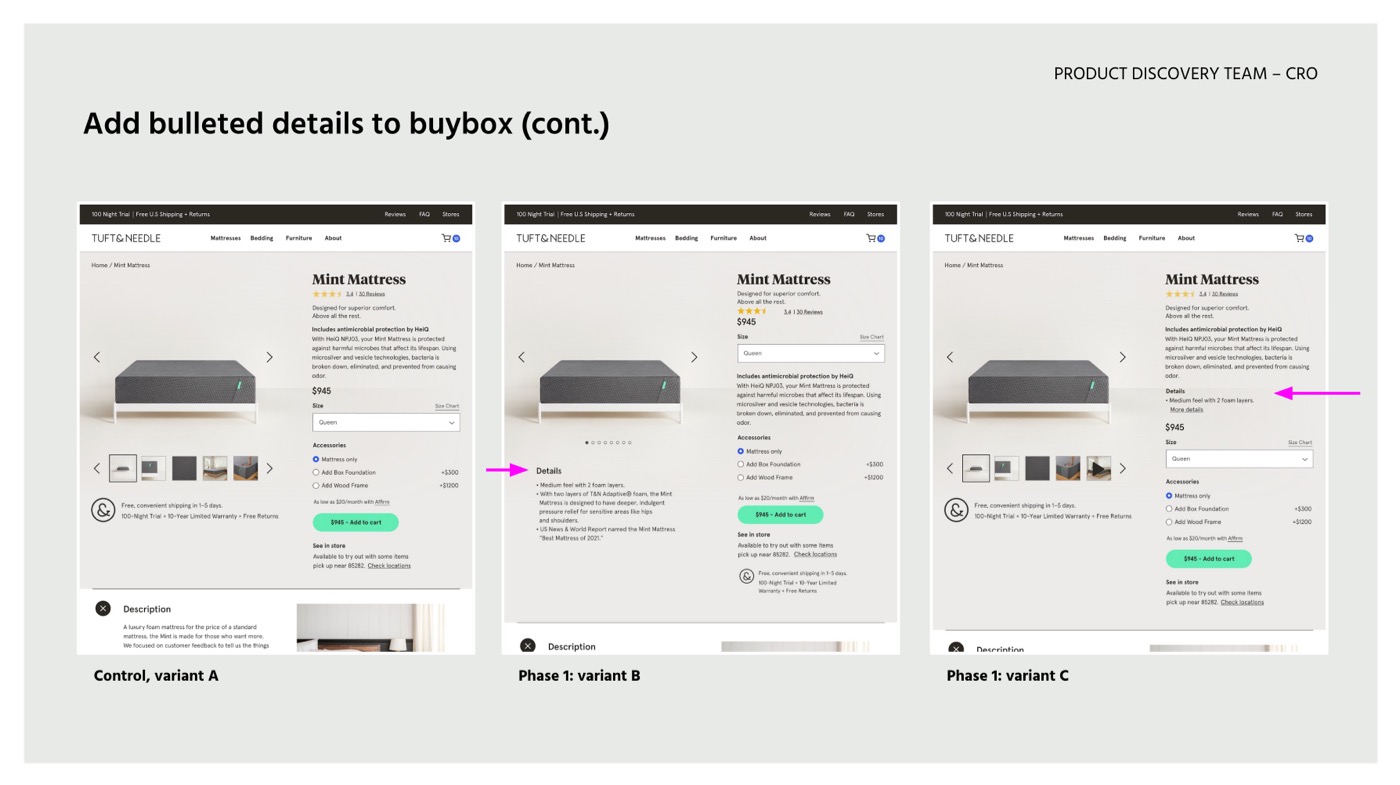
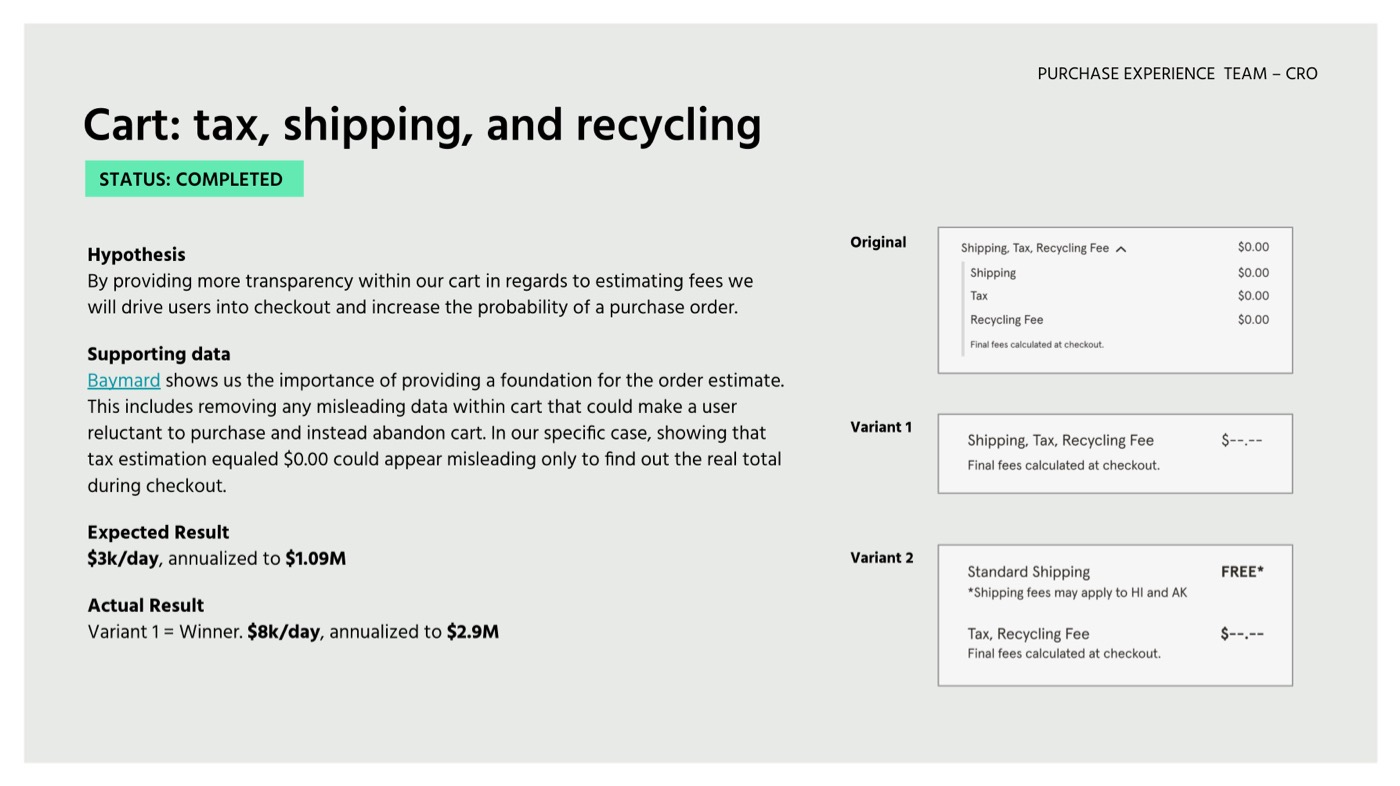
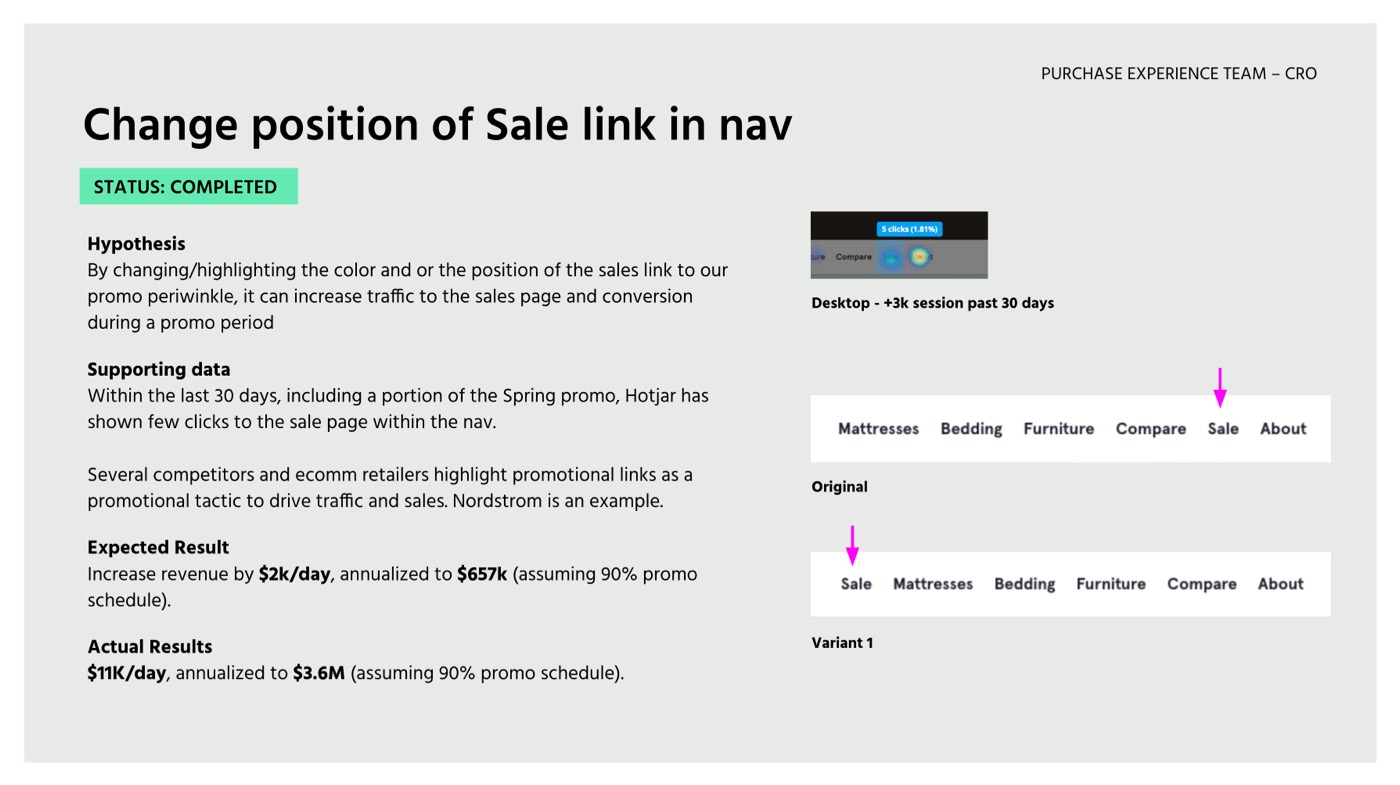
A few of our CRO experiments
The project was put on hold due to competing priorities and resource constraints during Q3. However, in total, we generated over $34.82M in incremental annualized revenue for the business during this time.
Thank Yous
Brooke Kao User Research
Ryan Evans Product Design
Cristian Valdes Product Design
Meaghan Socaciu Product Design
LoriAnne Carpenter Product & Project Management
Marilyn Cole Engineering & Project Management
Valery Peep Product & Project Management
Colin Darland Engineering Management
Jayson Virissimo Engineering Management